[1] 4Different Uses of Quarto
Intro
We have seen how to use Quarto to create pdf or html report Why would you want to do that?
Embedding code chunks
create easily reproducible content when you need to update numbers/tables etc
Similar syntax and tools can be used also to create:
Slides! (today)
Websites! (tomorrow)
Practicing Quarto documents
We saw that quarto documents. Let’s practice a few things.
Select File
New File
Quarto document
Title : “Practice Document”.
We will introduce this document to introduce ourselves. (2 min)
So go ahead and create a header for your file that states # Introduction.
Display code (or not?)
Quarto documents are nice because you can show the code you are using. Sometimes, this is not necessary - or maybe even undesirable!!
You still want code in the document - so that you can change things easily and reproduce figures, tables, results..
We have seen a code chunk is created via ```{r} ```
To not show the code, you can change it to ``{r, echo=F}``` .
Display code (or not?)
For example, I have some hidden code that computes the operation 3+1. When I render the document it will simply show:
Try it out (5 min)
Similarly to what we have done in the coding lab, try to write a small function that takes three arguments: the time of day, your name and last name, and prints “Good morning! My name is first_name last_name”.
Then run the function. For instance, running my function would look something like this: print_name("afternoon",bianca","brusco")
Try rendering the document.
Ensure that the output is there, but none of the code.
In this example, if the time of the day changes, you can just change the argument of
print_nameand the output in the quarto document will update.
Data Frames
Quarto can also be useful to visualize data. For instance, if I create a dataframe, it will display nicely in the document.
data.frame(
  "name" = c("Bianca","Mine","Volodymyr"),
  "job"=c("phd_student","professor","professor"),
  "residence" = c("irvine","los-angeles","irivne")
)
name job residence
1 Bianca phd_student irvine
2 Mine professor los-angeles
3 Volodymyr professor irivneTry creating a data.frame with two columns: “name” and “university”. Add your name and your neighbor’s name, and the respective University! Display the dataframe in the Quarto document, but no code!!
Adding tables (2 min)
Through the visual code editor, you can also add tables easily (if they are not in code).
| Letter | Number | Color |
|---|---|---|
| a | 1 | green |
| b | 2 | red |
| c | 3 | black |
Try reproducing this table in your document. Feel free to change the columns and rows. See how it prints on a rendered document. Go back to the Source pane. Here you can see how tables are actually defined in the Markdown language.
Adding images
Now, we will try to add an image to our document. Since we are introducing ourselves, pick an image that represents you. Using the visual code editor, simply click on the image icon and link to a path with the image you want to include.
- Render the file and make sure it’s there!
Using some math
How many use Latex? We can integrated it in the Quarto document, by including Latex code in a chunk delineated by $$
\[ y = mx + b \]
Otherwise, if you want to add math in-line, you can use a $ \beta $. Using this syntax for instance I cann write:
My favorite Greek letter is \(\beta\).
Try it out (5 min)
Add a new header so that a new section is created in you Quarto document, titled # Best math equation. Under it, try adding some Latex code . If you are new to Latex, you can just try it out using a simple equation for a line as in the previous slide.
If you have some experience, type out your favorite math equation to be rendered in your document.
Quarto Documents
Many other uses of Quarto, and you can use a lot of customization!!
For now, this should be most of what you need to know.
But you are always welcome to explore more options and ask if you get stuck.
Slides and Presentations
These slides (and the slides from this morning’s lecture!) are done using Quarto. I am going to show some examples from the Quarto website: https://quarto.org/docs/presentations/ Some basic syntax:
Slides and Presentations
In markdown, slides are mainly delineated using headings. For example, here is a simple slide show with two slides (each defined with a level 2 heading (
##)):title: "Habits" author: "John Doe" format: revealjs --- ## Getting up - Turn off alarm - Get out of bed ## Going to sleep - Get in bed - Count sheepThis will result in….
Getting up
- Turn off alarm
- Get out of bed
Going to sleep
- Get in bed
- Count sheep
Slides and Presentations
You can use a single level 1 heading (#) if you want to divide into sections. E.g.
---
title: "Habits"
author: "John Doe"
format: revealjs
---

# In the morning

## Getting up

- Turn off alarm
- Get out of bed

## Breakfast

- Eat eggs
- Drink coffee
For the following result:
In the morning
Getting up
- Turn off alarm
- Get out of bed
Breakfast
- Eat eggs
- Drink coffee
Slides and Presentations
If you don’t want a title, simply use:
---
title: "Habits"
author: "John Doe"
format: revealjs
---

- Turn off alarm
- Get out of bed

---

- Get in bed
- Count sheep
Slides: lists
To create bullet points, simply write bullet points in Quarto. If you want incremental slides
::: {.incremental}

- Eat spaghetti
- Drink wine

:::
Slides: lists
- This is
- How an
- Incremental Lists is Like
Go ahead and create your first presentation!!
Use these steps to make a presentation document in Quarto!!
- Select: File
- Select: New File
- Select: Quarto Presentation
- Set a title and use RevealJS engine!
Adding R code
We can use code chunks just like in the Quarto documents. For instance:
Note that by default, the code will not be displayed, but only the result will.
[1] 3To add R code as well, use {r echo=T} in the header of the code chunk.
Adding R code chunks
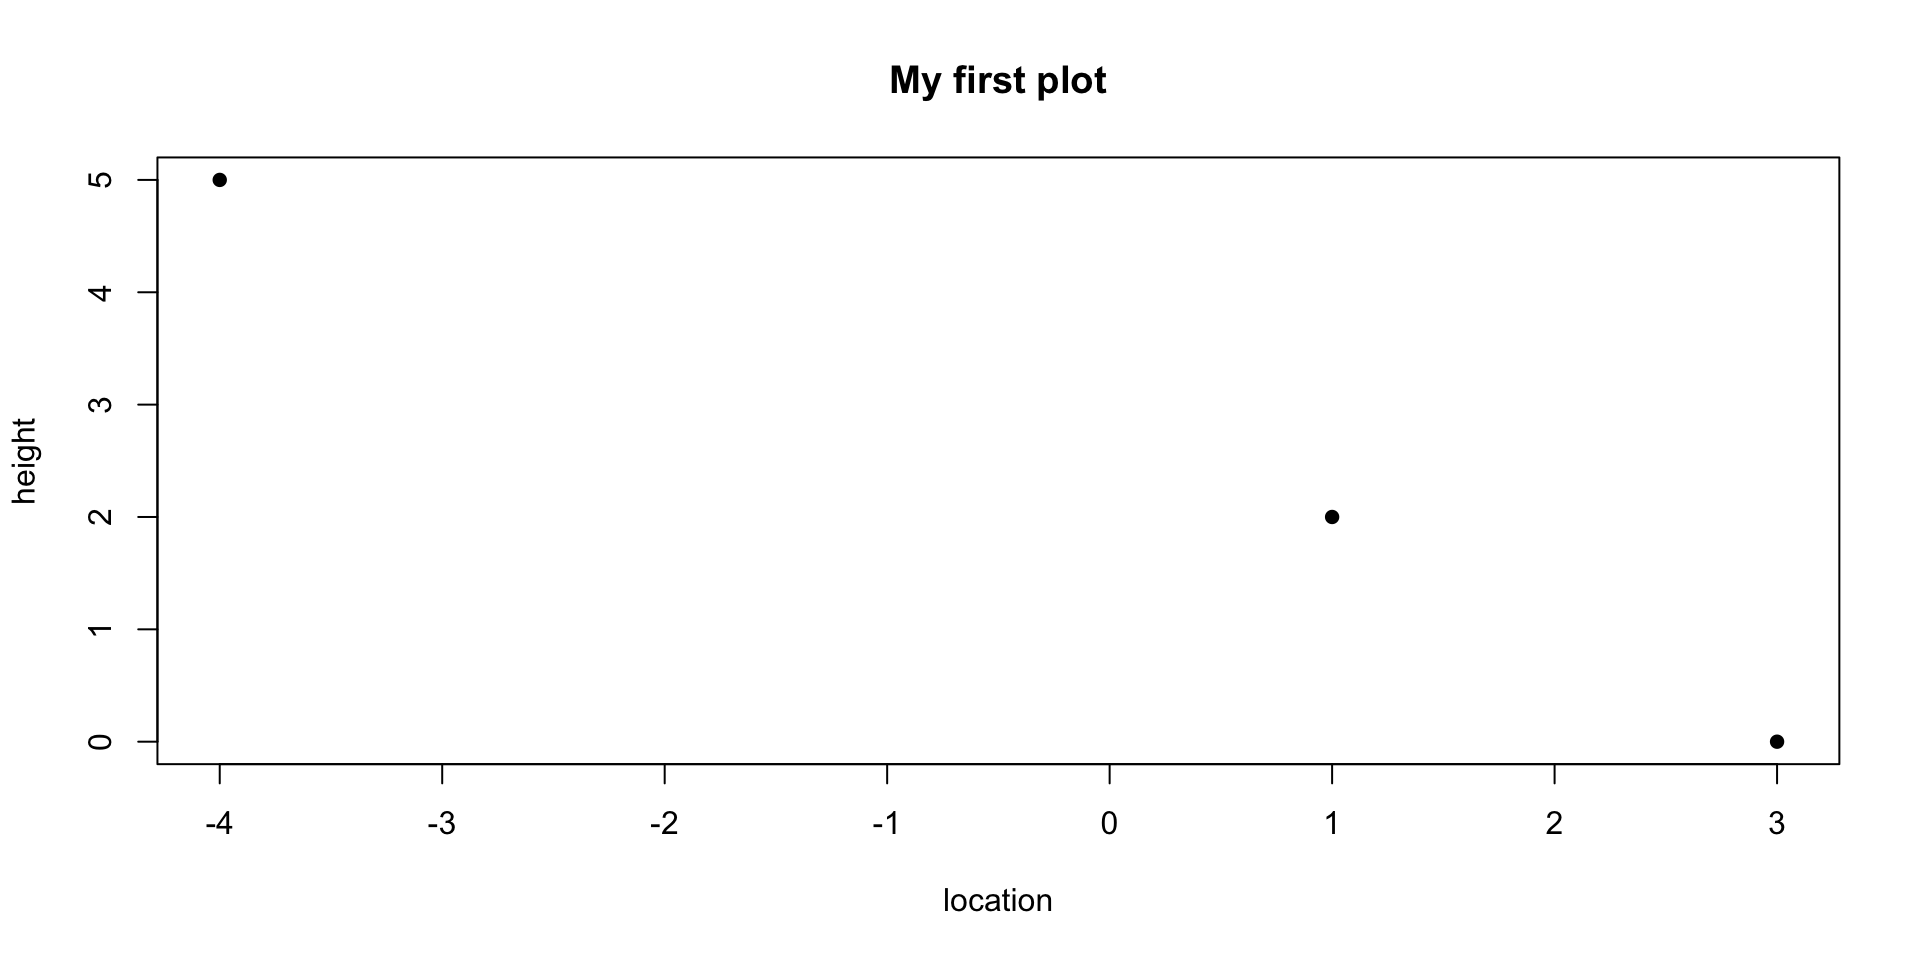
Now, try adding a code chunk from the previous lab with a basic plot. Make sure the plot displays properly in the slide!!
We want it looking like this:
Workshop
There are many other options to customize your slides! See the documentation https://quarto.org/docs/presentations/revealjs/ . If we have time, feel free to play around with different options and ask for help if you get stuck.