But… why writing a paper?
Personal satisfaction
- see project come together
Gain experience with scientific writing (essential in every data science jobs, not only academia)
Can talk about this experience in your cover letter for grad school
What affects accuracy?
- Something about the data analysis seems inaccurate/inappropriate
Tips
- Make sure to mention why a certain methodology was chosen, what else could be considered, why it was excluded
- Something about the interpretation of results seems inaccurate
Tip
Wait, so what is the answer to the research questions?
Avoid overgeneralizing or overstating your results
A good example
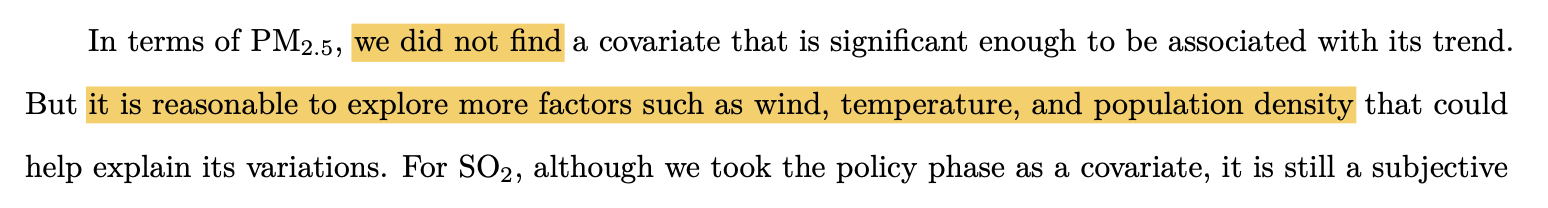
From Behind The Smoke: An Extreme Value Analysis Of Air Pollution In Minnesota by Yicheng Shen, Jacob Flignor, Libby Nachreiner, & Karen Wang
:::
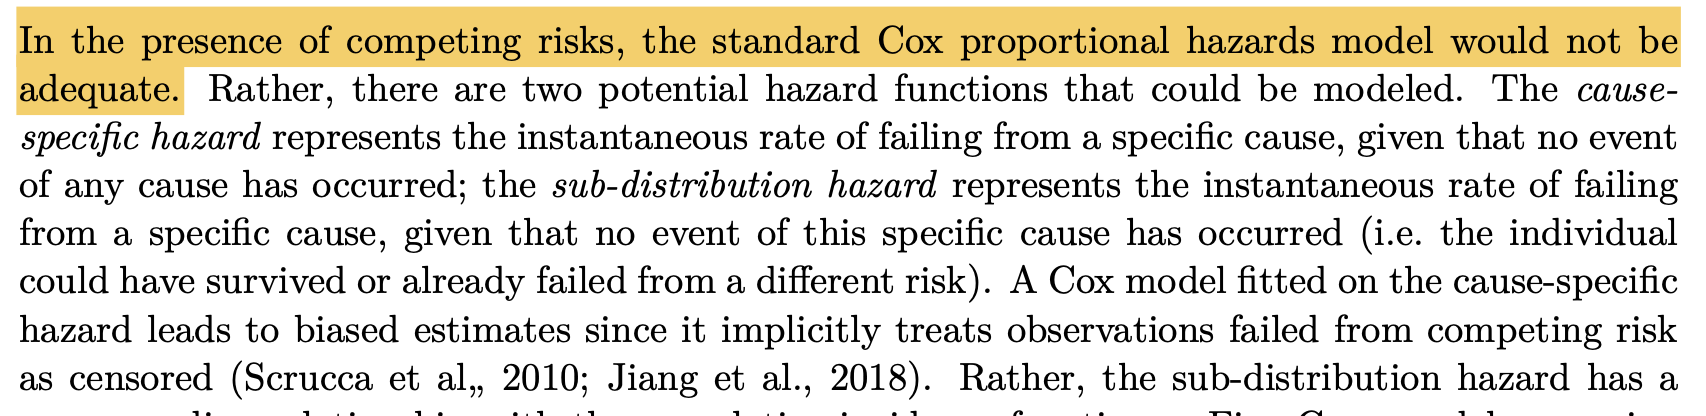
Methodology: accuracy
- Choose a statistical model that accounts for specific aspects of the application considered (and motivate the choice)
Example
From Psychiatric Comorbidity In Opioid Use Treatment Outcomes (Linda Tang, winner at 2021 Fall USRESP)
Methodology: clarity and presentation of notation
- Make notation concrete
Example
From An Evaluation Of Regularization Methods: When There Are More Predictors Than Observations (Kenny Chen, honorable mention at 2021 Fall USRESP)
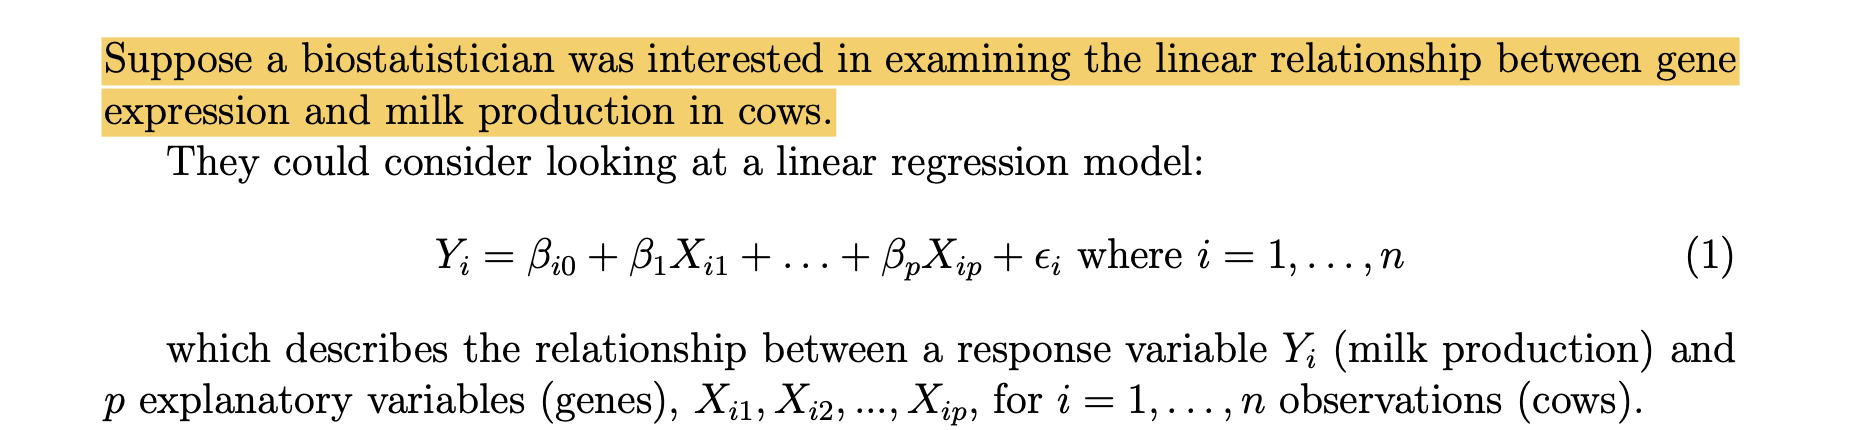
Note: in this paper, this excerpt was from the Introduction section
Methodology: clarity and presentation - can you visualize your methods?
Example
Design visualizations to help digest complicated methods
Write clear figure captions
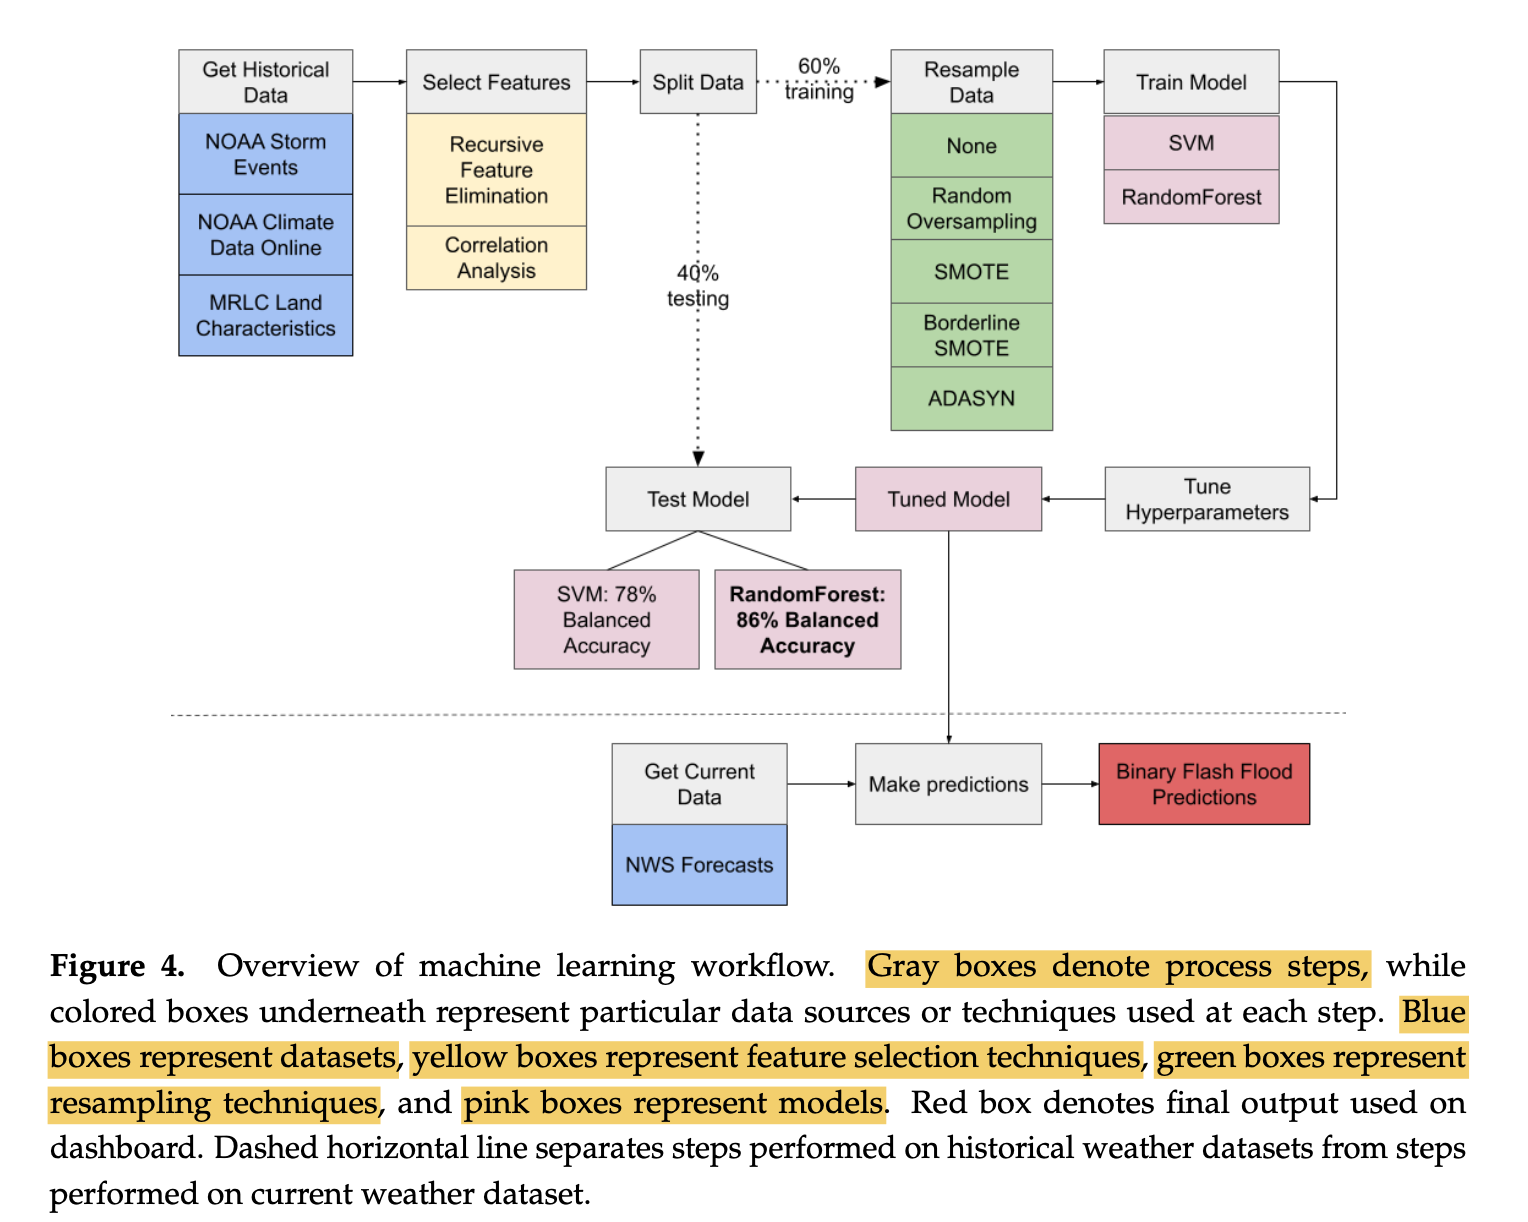
From Storm Chasers: Synthesizing New England Weather Data On A Dashboard For Emergency Response Workers (Irene Foster, Sunshine Schneider, Caitlin Timmons, Katelyn Diaz,winner at 2022 Fall USRESP)
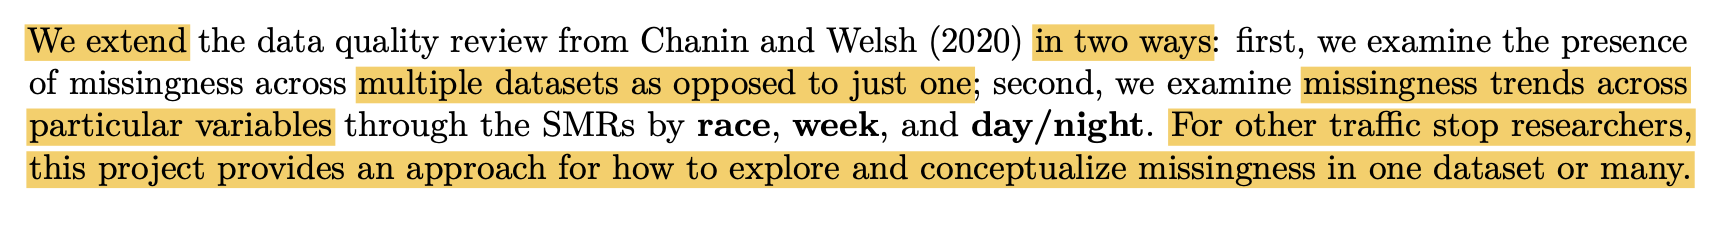
Introduction: originality, creativity and significance
- Highlight the contributions of your work Significance
Example
From Exploring Missingness and its Implications on Traffic Stop Data (Amber Lee, winner at 2020 Fall USRESP)
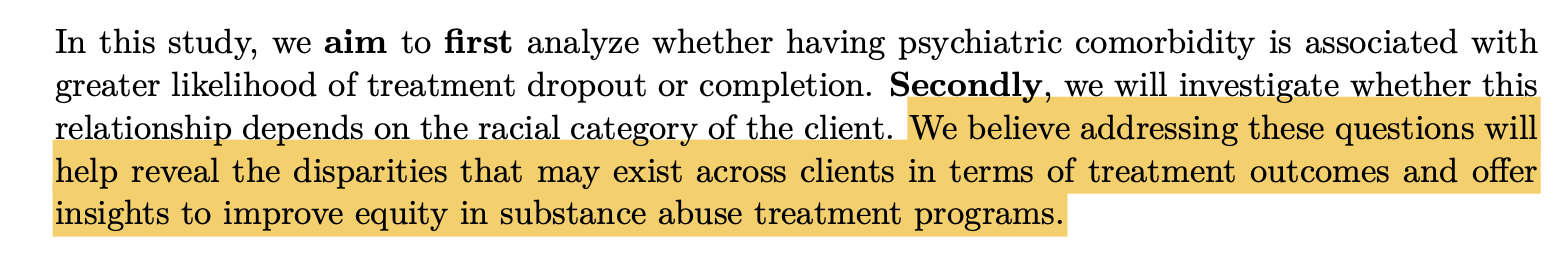
Introduction: originality, creativity and significance
- Highlight the potential implications of your work in thee real-world Significance
Example
From Psychiatric Comorbidity in Opioid Use Treatment Outcomes (Linda Tang , winner at 2021 Fall USRESP)
About you: submitting to USRESP
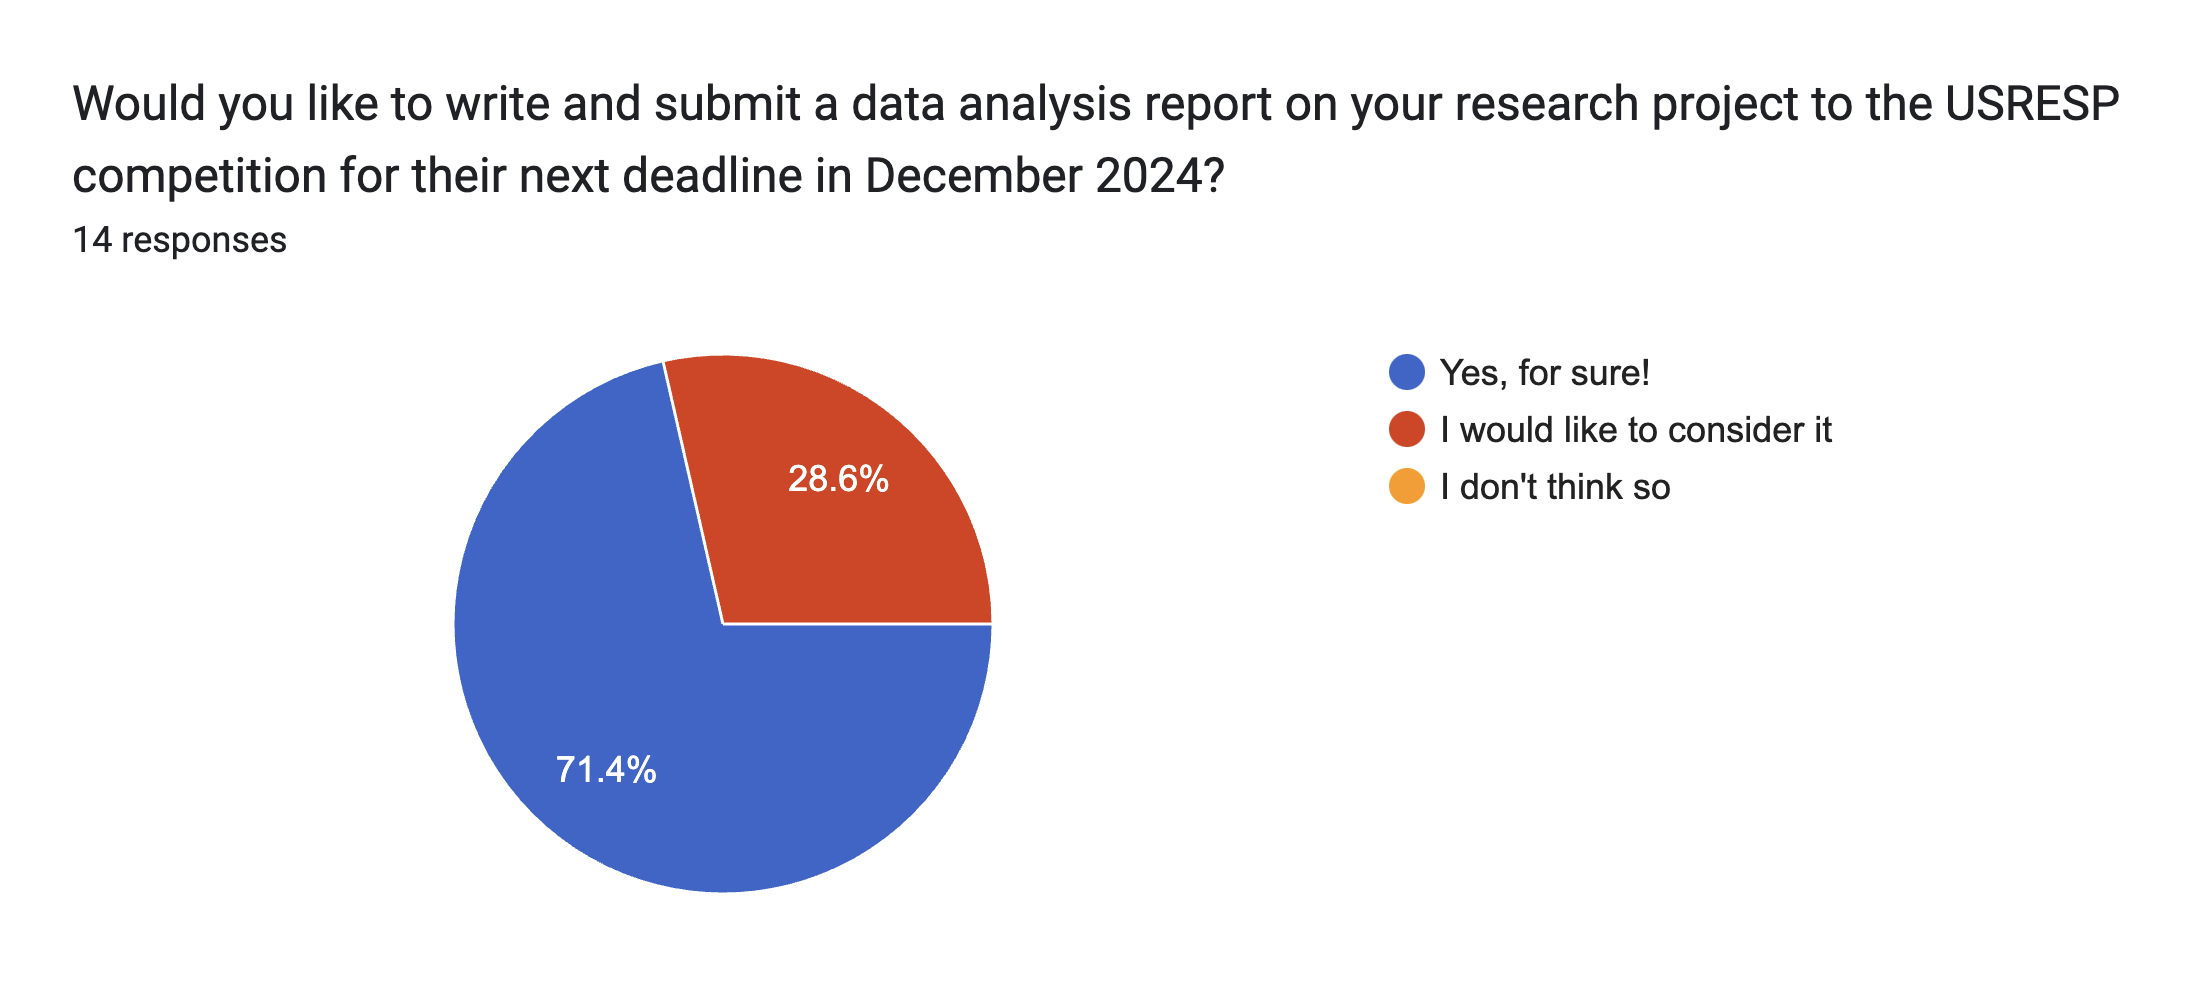
Discuss with your team:
Who in your team wants to participate to the writing?
Who could be your advisor(s) [that is, who could give you feedback and supervise your paper]? When will you ask them?
Your Feedback for me
Please take a moment to provide feedback for future editions of this workshop!
QR code